
Online Data Interpretation Test
- Home
- Data Interpretation
- Data Interpretation Test
Data Interpretation Test - Data Interpretation
| Marks : | ||
| Total number of questions | : | |
| Number of answered questions | : | |
| Number of unanswered questions | : | |
Test Review : View answers and explanation for this test.
Instruction:
- This is a FREE online test. DO NOT pay money to anyone to attend this test.
- Total number of questions : 20.
- Time alloted : 30 minutes.
- Each question carry 1 mark, no negative marks.
- DO NOT refresh the page.
- All the best :-).
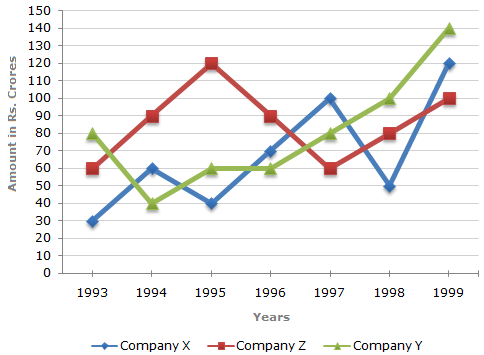
| 1. | In which year was the difference between the exports from Companies X and Y the minimum? |
|||||||||||
Your Answer: Option Correct Answer: Option C Explanation: The difference between the exports from the Companies X and Y during the various years are: In 1993 = Rs. (80 - 30) crores = Rs. 50 crores. In 1994 = Rs. (60 - 40) crores = Rs. 20 crores. In 1995 = Rs. (60 - 40) crores = Rs. 20 crores. In 1996 = Rs. (70 - 60) crores = Rs. 10 crores. In 1997 = Rs. (100 - 80) crores = Rs. 20 crores. In 1998 = Rs. (100 - 50) crores = Rs. 50 crores. In 1999 = Rs. (140 - 120) crores = Rs. 20 crores. Clearly, the difference is minimum in the year 1996. Learn more problems on : Data Interpretation Test Discuss about this problem : Discuss in Forum |
| 2. | In how many of the given years, were the exports from Company Z more than the average annual exports over the given years? |
|||||||||||||||||||||
Your Answer: Option Correct Answer: Option C Explanation: Average annual exports of Company Z during the given period
= Rs. 85.71 crores. From the analysis of graph the exports of Company Z are more than the average annual exports of Company Z (i.e., Rs. 85.71 crores) during the years 1994, 1995, 1996 and 1999, i.e., during 4 of the given years. Learn more problems on : Data Interpretation Test Discuss about this problem : Discuss in Forum |


Study the following table and answer the questions based on it.
Expenditures of a Company (in Lakh Rupees) per Annum Over the given Years.
| Year | Item of Expenditure | ||||
| Salary | Fuel and Transport | Bonus | Interest on Loans | Taxes | |
| 1998 | 288 | 98 | 3.00 | 23.4 | 83 |
| 1999 | 342 | 112 | 2.52 | 32.5 | 108 |
| 2000 | 324 | 101 | 3.84 | 41.6 | 74 |
| 2001 | 336 | 133 | 3.68 | 36.4 | 88 |
| 2002 | 420 | 142 | 3.96 | 49.4 | 98 |
| 3. | The total expenditure of the company over these items during the year 2000 is? |
|||||||||||
Your Answer: Option Correct Answer: Option A Explanation: Total expenditure of the Company during 2000 = Rs. (324 + 101 + 3.84 + 41.6 + 74) lakhs = Rs. 544.44 lakhs. Learn more problems on : Data Interpretation Test Discuss about this problem : Discuss in Forum |
The following pie-chart shows the percentage distribution of the expenditure incurred in publishing a book. Study the pie-chart and the answer the questions based on it.
Various Expenditures (in percentage) Incurred in Publishing a Book

| 4. | If for a certain quantity of books, the publisher has to pay Rs. 30,600 as printing cost, then what will be amount of royalty to be paid for these books? |
|||||||||||||||||
Your Answer: Option Correct Answer: Option C Explanation: Let the amount of Royalty to be paid for these books be Rs. r.
Learn more problems on : Data Interpretation Test Discuss about this problem : Discuss in Forum |
 r = Rs.
Study the following table and answer the questions based on it.
Expenditures of a Company (in Lakh Rupees) per Annum Over the given Years.
| Year | Item of Expenditure | ||||
| Salary | Fuel and Transport | Bonus | Interest on Loans | Taxes | |
| 1998 | 288 | 98 | 3.00 | 23.4 | 83 |
| 1999 | 342 | 112 | 2.52 | 32.5 | 108 |
| 2000 | 324 | 101 | 3.84 | 41.6 | 74 |
| 2001 | 336 | 133 | 3.68 | 36.4 | 88 |
| 2002 | 420 | 142 | 3.96 | 49.4 | 98 |
| 5. | The total amount of bonus paid by the company during the given period is approximately what percent of the total amount of salary paid during this period? |
|||||||||||||||||||||||||||||||
Your Answer: Option Correct Answer: Option C Explanation:
Learn more problems on : Data Interpretation Test Discuss about this problem : Discuss in Forum |


 1%.
1%.Study the following table and answer the questions based on it.
Expenditures of a Company (in Lakh Rupees) per Annum Over the given Years.
| Year | Item of Expenditure | ||||
| Salary | Fuel and Transport | Bonus | Interest on Loans | Taxes | |
| 1998 | 288 | 98 | 3.00 | 23.4 | 83 |
| 1999 | 342 | 112 | 2.52 | 32.5 | 108 |
| 2000 | 324 | 101 | 3.84 | 41.6 | 74 |
| 2001 | 336 | 133 | 3.68 | 36.4 | 88 |
| 2002 | 420 | 142 | 3.96 | 49.4 | 98 |
| 6. | What is the average amount of interest per year which the company had to pay during this period? |
|||||||||||||||||||||||
Your Answer: Option Correct Answer: Option D Explanation: Average amount of interest paid by the Company during the given period
= Rs. 36.66 lakhs. Learn more problems on : Data Interpretation Test Discuss about this problem : Discuss in Forum |
The following pie-chart shows the percentage distribution of the expenditure incurred in publishing a book. Study the pie-chart and the answer the questions based on it.
Various Expenditures (in percentage) Incurred in Publishing a Book
| 7. | Royalty on the book is less than the printing cost by: |
|||||||||||||||||||||||||||||||||||||
Your Answer: Option Correct Answer: Option D Explanation: Printing Cost of book = 20% of C.P. Royalty on book = 15% of C.P. Difference = (20% of C.P.) - (15% of C.P) = 5% of C.P.
Learn more problems on : Data Interpretation Test Discuss about this problem : Discuss in Forum |
||||||||||||||||||||||||||||||||||||||
 Percentage difference
The following pie-chart shows the percentage distribution of the expenditure incurred in publishing a book. Study the pie-chart and the answer the questions based on it.
Various Expenditures (in percentage) Incurred in Publishing a Book
| 8. | If 5500 copies are published and the transportation cost on them amounts to Rs. 82500, then what should be the selling price of the book so that the publisher can earn a profit of 25%? |
|||||||||||||||||||||||
Your Answer: Option Correct Answer: Option A Explanation: For the publisher to earn a profit of 25%, S.P. = 125% of C.P. Also Transportation Cost = 10% of C.P. Let the S.P. of 5500 books be Rs. x.
Learn more problems on : Data Interpretation Test Discuss about this problem : Discuss in Forum |
Study the following table and answer the questions based on it.
Expenditures of a Company (in Lakh Rupees) per Annum Over the given Years.
| Year | Item of Expenditure | ||||
| Salary | Fuel and Transport | Bonus | Interest on Loans | Taxes | |
| 1998 | 288 | 98 | 3.00 | 23.4 | 83 |
| 1999 | 342 | 112 | 2.52 | 32.5 | 108 |
| 2000 | 324 | 101 | 3.84 | 41.6 | 74 |
| 2001 | 336 | 133 | 3.68 | 36.4 | 88 |
| 2002 | 420 | 142 | 3.96 | 49.4 | 98 |
| 9. | Total expenditure on all these items in 1998 was approximately what percent of the total expenditure in 2002? |
|||||||||||||||||||||||||||||||
Your Answer: Option Correct Answer: Option C Explanation:
Learn more problems on : Data Interpretation Test Discuss about this problem : Discuss in Forum |
The following pie-chart shows the percentage distribution of the expenditure incurred in publishing a book. Study the pie-chart and the answer the questions based on it.
Various Expenditures (in percentage) Incurred in Publishing a Book
| 10. | If the difference between the two expenditures are represented by 18° in the pie-chart, then these expenditures possibly are |
||||||||||||||||||||||
Your Answer: Option Correct Answer: Option D Explanation:
= 5% of the total expenditure. From the given chart it is clear that: Out of the given combinations, only in combination (d) the difference is 5% i.e.
Learn more problems on : Data Interpretation Test Discuss about this problem : Discuss in Forum |
The following pie-chart shows the percentage distribution of the expenditure incurred in publishing a book. Study the pie-chart and the answer the questions based on it.
Various Expenditures (in percentage) Incurred in Publishing a Book
| 11. | For an edition of 12,500 copies, the amount of Royalty paid by the publisher is Rs. 2,81,250. What should be the selling price of the book if the publisher desires a profit of 5%? |
|||||||||||||||||||||||
Your Answer: Option Correct Answer: Option B Explanation: Clearly, S.P. of the book = 105% of C.P. Let the selling price of this edition (of 12500 books) be Rs. x.
Learn more problems on : Data Interpretation Test Discuss about this problem : Discuss in Forum |
The bar graph given below shows the sales of books (in thousand number) from six branches of a publishing company during two consecutive years 2000 and 2001.
Sales of Books (in thousand numbers) from Six Branches - B1, B2, B3, B4, B5 and B6 of a publishing Company in 2000 and 2001.

| 12. | What percent of the average sales of branches B1, B2 and B3 in 2001 is the average sales of branches B1, B3 and B6 in 2000? |
||||||||||||||||||||||||||||||||||||||||||||
Your Answer: Option Correct Answer: Option D Explanation: Average sales (in thousand number) of branches B1, B3 and B6 in 2000
Average sales (in thousand number) of branches B1, B2 and B3 in 2001
Learn more problems on : Data Interpretation Test Discuss about this problem : Discuss in Forum |
The following pie-chart shows the percentage distribution of the expenditure incurred in publishing a book. Study the pie-chart and the answer the questions based on it.
Various Expenditures (in percentage) Incurred in Publishing a Book
| 13. | Which two expenditures together have central angle of 108°? |
||||||||||||||||||||||
Your Answer: Option Correct Answer: Option A Explanation:
= 30% of the total expenditure. From the pie chart it is clear that:
Learn more problems on : Data Interpretation Test Discuss about this problem : Discuss in Forum |
The following pie-chart shows the percentage distribution of the expenditure incurred in publishing a book. Study the pie-chart and the answer the questions based on it.
Various Expenditures (in percentage) Incurred in Publishing a Book
| 14. | The price of the book is marked 20% above the C.P. If the marked price of the book is Rs. 180, then what is the cost of the paper used in a single copy of the book? |
|||||||||||||||||
Your Answer: Option Correct Answer: Option B Explanation: Clearly, marked price of the book = 120% of C.P. Also, cost of paper = 25% of C.P Let the cost of paper for a single book be Rs. n.
Learn more problems on : Data Interpretation Test Discuss about this problem : Discuss in Forum |
The following pie-chart shows the percentage distribution of the expenditure incurred in publishing a book. Study the pie-chart and the answer the questions based on it.
Various Expenditures (in percentage) Incurred in Publishing a Book
| 15. | What is the central angle of the sector corresponding to the expenditure incurred on Royalty? |
|||||||||||
Your Answer: Option Correct Answer: Option C Explanation: Learn more problems on : Data Interpretation Test Discuss about this problem : Discuss in Forum |
| 16. | For which of the following pairs of years the total exports from the three Companies together are equal?
|
|||||||||||
Your Answer: Option Correct Answer: Option D Explanation: Total exports of the three Companies X, Y and Z together, during various years are: In 1993 = Rs. (30 + 80 + 60) crores = Rs. 170 crores. In 1994 = Rs. (60 + 40 + 90) crores = Rs. 190 crores. In 1995 = Rs. (40 + 60 + 120) crores = Rs. 220 crores. In 1996 = Rs. (70 + 60 + 90) crores = Rs. 220 crores. In 1997 = Rs. (100 + 80 + 60) crores = Rs. 240 crores. In 1998 = Rs. (50 + 100 + 80) crores = Rs. 230 crores. In 1999 = Rs. (120 + 140 + 100) crores = Rs. 360 crores. Clearly, the total exports of the three Companies X, Y and Z together are same during the years 1995 and 1996. Learn more problems on : Data Interpretation Test Discuss about this problem : Discuss in Forum |
Study the following table and answer the questions based on it.
Expenditures of a Company (in Lakh Rupees) per Annum Over the given Years.
| Year | Item of Expenditure | ||||
| Salary | Fuel and Transport | Bonus | Interest on Loans | Taxes | |
| 1998 | 288 | 98 | 3.00 | 23.4 | 83 |
| 1999 | 342 | 112 | 2.52 | 32.5 | 108 |
| 2000 | 324 | 101 | 3.84 | 41.6 | 74 |
| 2001 | 336 | 133 | 3.68 | 36.4 | 88 |
| 2002 | 420 | 142 | 3.96 | 49.4 | 98 |
| 17. | The ratio between the total expenditure on Taxes for all the years and the total expenditure on Fuel and Transport for all the years respectively is approximately? |
|||||||||||
Your Answer: Option Correct Answer: Option B Explanation: Learn more problems on : Data Interpretation Test Discuss about this problem : Discuss in Forum |
| 18. | Average annual exports during the given period for Company Y is approximately what percent of the average annual exports for Company Z? |
||||||||||||||||||||||||||||||||||||||
Your Answer: Option Correct Answer: Option D Explanation: Analysis of the graph: From the graph it is clear that
Average annual exports (in Rs. crore) of Company Y during the given period
Average annual exports (in Rs. crore) of Company Z during the given period
Learn more problems on : Data Interpretation Test Discuss about this problem : Discuss in Forum |
The bar graph given below shows the sales of books (in thousand number) from six branches of a publishing company during two consecutive years 2000 and 2001.
Sales of Books (in thousand numbers) from Six Branches - B1, B2, B3, B4, B5 and B6 of a publishing Company in 2000 and 2001.
| 19. | Total sales of branch B6 for both the years is what percent of the total sales of branches B3 for both the years? |
|||||||||||
Your Answer: Option Correct Answer: Option C Explanation: Learn more problems on : Data Interpretation Test Discuss about this problem : Discuss in Forum |
The bar graph given below shows the sales of books (in thousand number) from six branches of a publishing company during two consecutive years 2000 and 2001.
Sales of Books (in thousand numbers) from Six Branches - B1, B2, B3, B4, B5 and B6 of a publishing Company in 2000 and 2001.
| 20. | Total sales of branches B1, B3 and B5 together for both the years (in thousand numbers) is? |
|||||||||||
Your Answer: Option Correct Answer: Option D Explanation: Total sales of branches B1, B3 and B5 for both the years (in thousand numbers) = (80 + 105) + (95 + 110) + (75 + 95) = 560. Learn more problems on : Data Interpretation Test Discuss about this problem : Discuss in Forum |
Questions & Answers
Aptitude Chemical Engineering Civil Engineering Computer Science & Engineering Current Affairs Data Interpretation Electrical & Electronics Engineering Electronics & Communication Engineering General Knowledge Logical Reasoning Mechanical Engineering Non Verbal Reasoning Verbal Ability Verbal ReasoningInterviews
HR InterviewJobs
Sarkari JobsAdmission
Admission 2023Admit Card
Admit Card 2023Answer Key
Answer Key 2023Data Interpretation Test - Data Interpretation